Kallvatten in till UC, två parallellkopplade mätare.
[Table2Chart id=”1″ type=”line” width=”640″ height=”300″ background=”#f6f6ff” title=”Dygnsmedelvärde” color=”#0000ff” titley=”Kubikmeter/dygn”]
chart: {
border: 0,
padding: 0,
},
credits:{enabled:false},
plotOptions: {
series: {
lineWidth: 5
}
},
xAxis: {
reversed: true,
labels: {
rotation: 90
}
},
yAxis: {
plotBands: [{
color: ’#FcCccC’,
from: 11,
to: 15
}]
}
[/Table2Chart]
| Datum | K.v.[m3/dygn] |
| 240901 | 6,72 |
| 240601 | 7,15 |
| 240301 | 6,81 |
| 231201 | 7,49 |
| 230901 | 7,51 |
| 230601 | 8,21 |
| 230301 | 7,78 |
| 221201 | 7,31 |
| 220901 | 7,43 |
| 220601 | 7,93 |
| 220301 | 10,81 |
| 211201 | 8,40 |
| 210901 | 7,96 |
| 210601 | 8,65 |
| 210301 | 8,67 |
| 201201 | 8,43 |
| 200901 | 8,47 |
| 200601 | 8,96 |
| 200301 | 9,22 |
| 191201 | 7,00 |
| 190901 | 8,02 |
| 190601 | 8,09 |
| 190301 | 8,06 |
| 181201 | 7,93 |
| 180901 | 8,1 |
| 180601 | 8,41 |
| 180301 | 7,97 |
| 171201 | 8,08 |
| 170901 | 8,07 |
| 170601 | 8,63 |
| 170301 | 8,64 |
| 161201 | 8,25 |
| 160901 | 8,57 |
| 160601 | 8,7 |
| 160301 | 8,85 |
| 151201 | 8,71 |
| 150901 | 7,75 |
| 150601 | 10,11 |
| 150301 | 10,12 |
| 141201 | 9,8 |
| 140901 | 9,75 |
| 140601 | 9,95 |
| 140301 | 8,96 |
| 131201 | 9,05 |
| 130901 | 9,6 |
| 130601 | 11,99 |
| 130301 | 12,87 |
| 121201 | 13,3 |
| 120901 | 11,11 |
| 120601 | 10,27 |
| 120301 | 9,63 |
| 111201 | 9,73 |
| 110901 | 9,26 |
| 110601 | 9,87 |
| 110301 | 9,32 |
[tab name=”Bild ur excel-fil”]Alla mätare, avstämda avläsningar från alla fastigheter.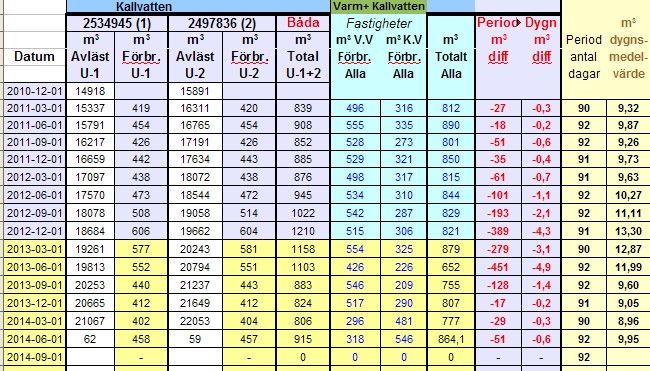
[/tab]
[/tab]
(Tabbar,
insatta i TinyMCE Editor,
via plugin:
-Post UI Tabs,
-Tabl2Chart,
samt PHP-kod från WordPress Codex
– Interfacing with databases)